INSIDE A COUNTRY PROFILE
Whats there inside each country profile, how to read it?
ABOUT COUNTRY
This section gives a quick intro to the country, a few keywords that sum up its cuisine, and a look at which countries it’s most and least similar to based on shared ingredients (thanks to ObjectiveLists, who created this similarity index).
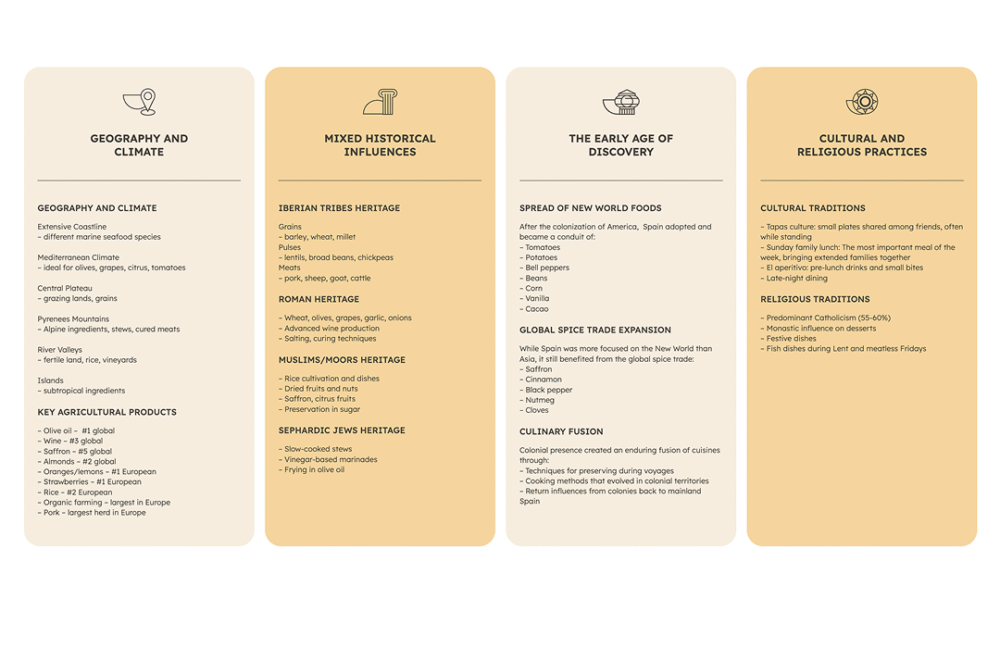
INFLUENCES
What ends up on your dinner plate tonight isn’t just random chance. It’s the result of this amazing culinary story that’s been unfolding for centuries.
Where a country sits on the map obviously matters, but it goes way deeper than that. The weather patterns shape what grows well, who conquered or ruled a place brought their own food traditions along, busy trade routes introduced exotic spices and techniques, religious beliefs determined what foods were celebrated or off-limits.
All these influences blend together over time to create those distinctive national signatures. It’s why your grandmother’s recipes might include ingredients that traveled halfway around the world centuries ago before becoming “traditional” in your family.
So when you’re having a local dish somewhere, you’re also experiencing a history lesson of all the influences stirred together into something unique.
STAPLE INGREDIENTS
When you look at real quantities — how much rice, corn, or wheat people actually eat — you get a clearer picture than what tourist menus show.
The data highlights what truly sits at the heart of a cuisine: what everyday families are serving at home on a Tuesday night after work.
We use key ingredients data in grams per person per day from the Food and Agriculture Organization (of the United Nations). Their Food Balance Sheets are basically the standard for measuring what’s actually available on people’s plates worldwide.
We averaged food consumption over three years (2019-2021) – kind of like how you wouldn’t judge someone’s eating habits from just one day. Same with countries – we needed to smooth out those temporary blips from things like weird weather years or market changes and see the bigger picture – instead of just a momentarily snapshot, we get a more stable view of typical patterns.
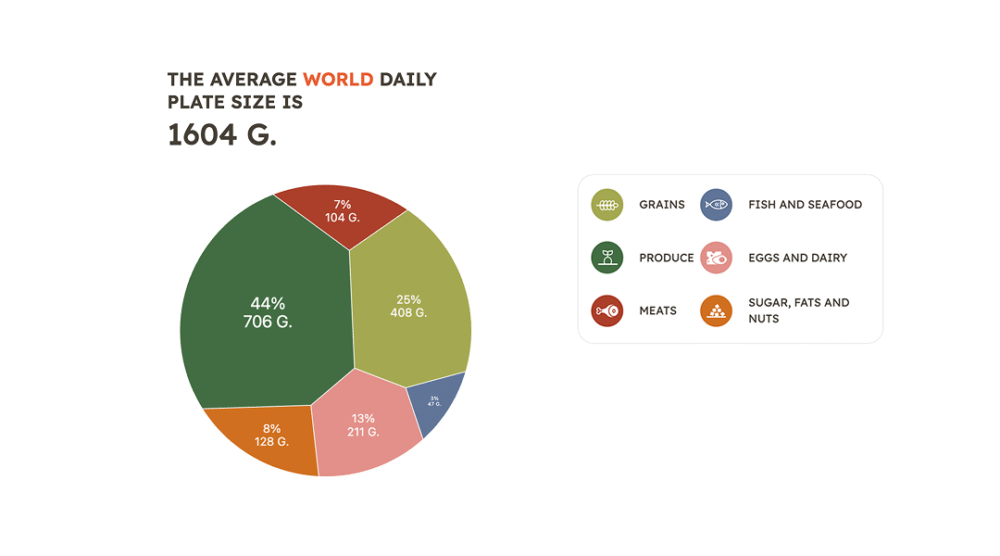
This ‘plate’ chart shows the world average of how much people eat daily – every country has its own unique plate. Think of it like this: an average person worldwide consumes about 1,604 grams of food daily.
Almost half our plates (44%) are filled with fruits and vegetables – a 706 grams daily. Grains like rice, wheat, and corn make up another quarter of what we eat. Dairy products and eggs account for 14% of our daily food, while sugars, fats and nuts make up 8%. Surprisingly, meat is just a small slice of the global diet at 7%, and seafood is truly tiny at only 3% – despite how important fish is in many coastal countries.
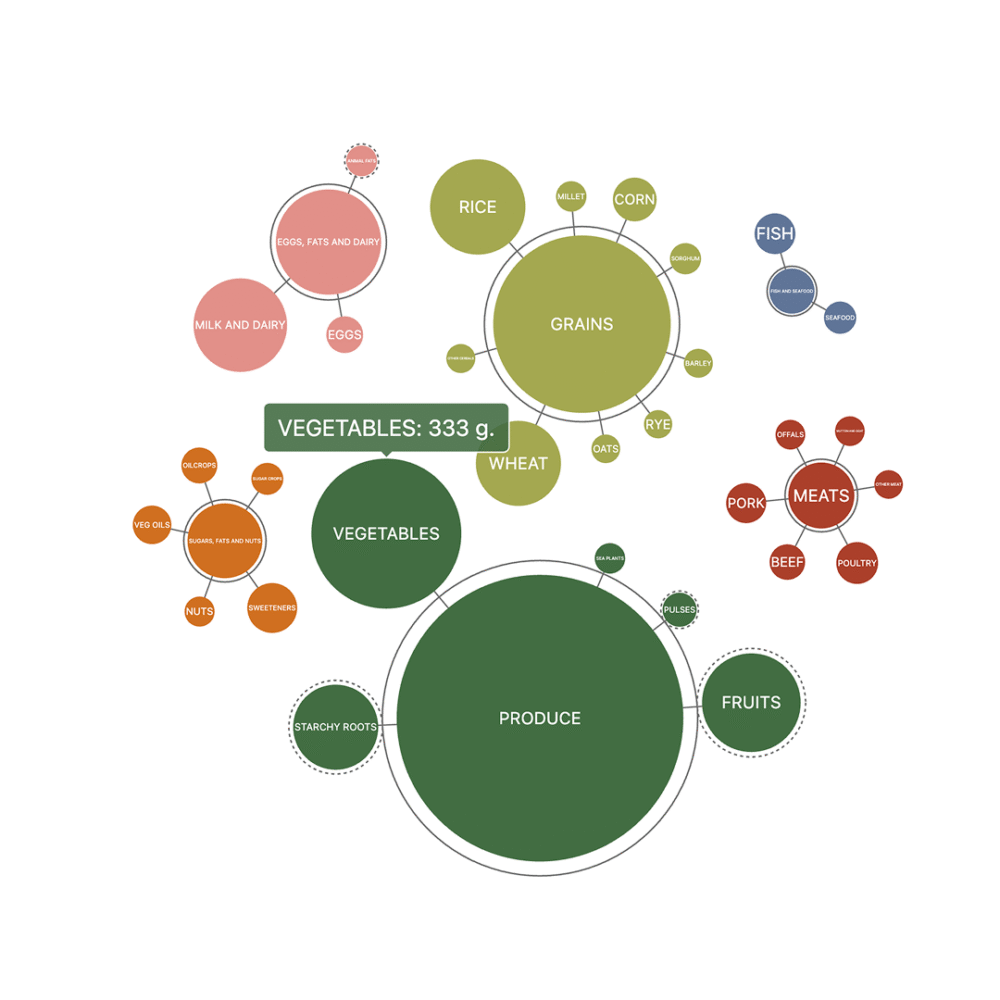
The bubble diagram offers a deeper exploration of each plate category. It drills down into the specific components within each category. The size of each bubble corresponds to the weight in grams of that particular food type. For example, within the “Produce” category (shown here as 44% or 704g of the daily plate), the bubble diagram reveals the deeper breakdown between vegetables, fruits, starchy roots, pulses and sea plants by their relative weights.
The six food groupings are custom-made to better suit the culinary perspective and may slightly vary from those reported by FAO. Alcoholic, fresh drinks, stimulants, spices and miscellaneous items represent a very specific consumption and are therefore removed from totals to concentrate only on dietary foundation.
These numbers show raw ingredients, not final dishes. So when you see “milk” in the data, keep in mind that people aren’t necessarily drinking it all straight from the glass. That milk might have become cheese, yogurt, butter.
In graphs we focus on grams rather than calories. Here’s why: weight gives us a consistent measure, while calories can vary based on preparation methods and added ingredients. Fat contains more calories per gram than carbs or protein. By tracking raw ingredients by weight, we can better compare consumption patterns across countries. Still, when comparing ingredients by weight, we need to be cautious – liquids like milk are significantly heavier than dry ingredients like flour or spices for the same volume.
KEY FLAVORINGS
While tracking all food ingredients, we handle flavorings differently. Spices and seasonings absolutely make or break a dish’s character, but we don’t count them in our total consumption calculations. Their tiny weights—often just a pinch here and there—would throw off the bigger picture. Instead, we organize all flavorings into four distinct groups.
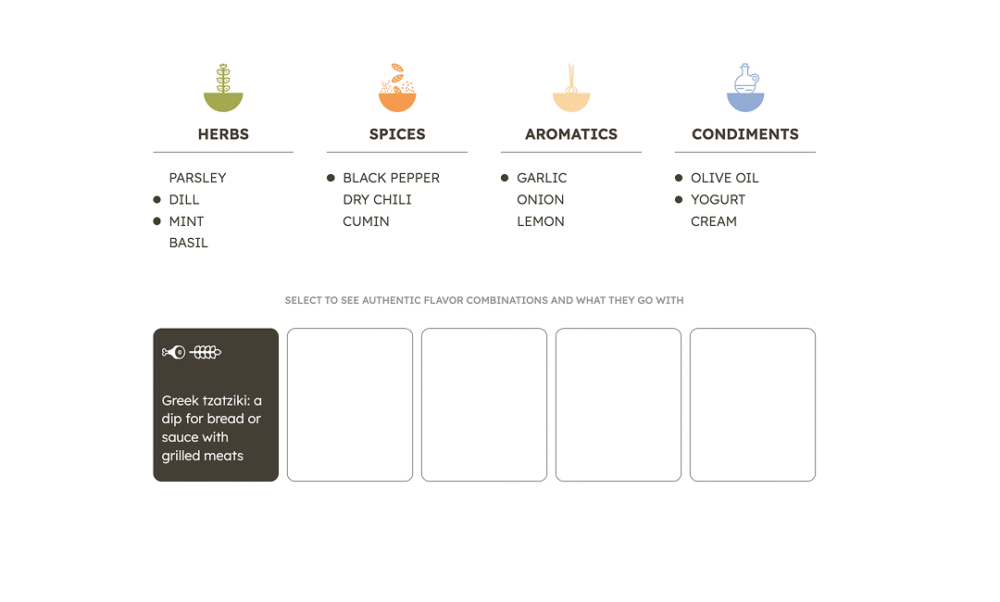
HERBS – fresh or dried leaves and stems used to enhance flavor
SPICES – dried seeds, bark, roots powdered or ground and used for seasoning, typically in small quantities
AROMATICS – base ingredients that build flavor when cooked, or give the end notes to a dish
CONDIMENTS – oils, pastes, crunchy nuts, extracts or other characteristic ingredients used to add flavor
We focus on 30-35 flavors that define each cuisine, recognizing that dozens more ingredients are actually used in practice. Salt is universal in global cuisine – every country incorporates it in some form. For our overview of defining flavor profiles by country, salt is excluded. While salt is fundamental, the differences in how it’s used between cuisines are subtle compared to the dramatic distinctions created by other flavor elements.
Underneath the chart, you’ll see buttons with icons. Each button represents a classic country flavor combination used for specific types of dishes—like breads, grilled meats, or desserts. Button click will highlight ingredients used in that flavor combination with black dots. The icons on each button tells what kind of dishes the combination is used for.
As you explore different countries in the navigation, you’ll discover new flavor combinations unique to each cuisine, with buttons that highlight their traditional ingredient pairings.
ICONIC DISHES
This section highlights signature dishes from each country, grouped by the primary ingredient type they are based on. Explore the cuisine through its essential building blocks—grains, produce, meats, seafood, dairy, and sweets—to better understand how typical meals come together.